Visualisation Guide

Version: 0.9.8.1

Overview

The library generates visualisations to help interpret analysis results, particularly for impact analysis and change point detection. This guide explains how to read and interpret plot types, including correlation risk context when CPC and CTR move inversely.

Individual Metric Analysis Plots

Generates enhanced two-panel plots for each metric (CPC or CTR) with detailed analytical overlays.

CTR Analysis Example

CTR Analysis with Impact Visualisation

Top Panel: Time Series with Impact Context

Displays primary metric over time with key analytical overlays:

Time Series Line (Blue)

  • Shows actual metric values over analysis period

  • Connected points indicate daily performance measurements

  • Fluctuations reveal natural variation and trend changes

Benchmark Line (Green Dashed)

  • Horizontal line representing calculated benchmark value

  • Derived from period of optimal stable performance

  • Serves as reference point for impact calculations

Benchmark Period Highlighting (Light Blue Shaded Area)

  • Indicates time period used to establish benchmark

  • Typically represents longest stable or improving performance segment

  • Provides visual context for benchmark derivation

Segment Trend Labels

  • Text annotations showing identified trend classifications

  • “STABLE” indicates periods of consistent performance

  • “DECLINING” marks periods where performance deteriorates

  • “IMPROVING” shows periods of performance enhancement

  • Based on signature-based change point detection

Underperformance Areas (Red Shaded Regions)

  • Highlight periods where actual performance falls below benchmark

  • Only shown for declining periods after benchmark period ends

  • Area size reflects magnitude of impact (e.g., engagement gap)

  • Vertical red lines mark boundaries of impact periods

Change Points (Red Vertical Lines)

  • Mark significant pattern changes detected by signature analysis

  • Indicate transitions between different performance phases

  • Based on mathematical signature distance calculations

Bottom Panel: Signature Distance Analysis

Shows sophisticated mathematical analysis underlying change point detection:

Signature Distance Line (Green with Dots)

  • Each point represents mathematical “distance” between consecutive time windows

  • Higher values indicate greater changes in underlying pattern

  • Based on rough path theory and signature calculations

  • Provides quantitative measure of pattern evolution

Detection Threshold (Red Horizontal Line)

  • Threshold value for anomaly detection

  • When signature distances exceed this threshold, significant changes are flagged

  • Automatically calculated based on data characteristics and statistical properties

Anomaly Markers (Red X)

  • Mark time points where signature distances exceeded threshold

  • Correspond to change points shown in top panel

  • Indicate statistically significant pattern shifts

  • Enable precise timing of performance transitions

Impact Analysis Dashboard

For detailed analysis, generates a four-panel dashboard summarising impact with separate operational (clicks) and financial (GBP) indicators.

Impact Analysis Example

Impact Analysis Example

Panel 1: CPC Analysis (Top Left)

Mirrors individual CPC analysis with:

  • CPC time series with benchmark line and impact highlighting

  • Segment trend classifications

  • Change point markers

  • Underperformance area visualisation

Panel 2: CTR Analysis (Top Right)

Mirrors individual CTR analysis with:

  • CTR time series with benchmark line and impact highlighting

  • Segment trend classifications

  • Change point markers

  • Underperformance area visualisation

Panel 3: Impact Indicators (Bottom Left)

Primary and Reference Indicators

  • engagement_gap_clicks (primary): Lost clicks relative to benchmark (operational)

  • actual_overspend_gbp (secondary): Actual overspend relative to benchmark (financial)

  • Do not add or combine these metrics; they are conceptually distinct

Panel 4: Summary and Risk Assessment (Bottom Right)

Detailed Text Summary Including:
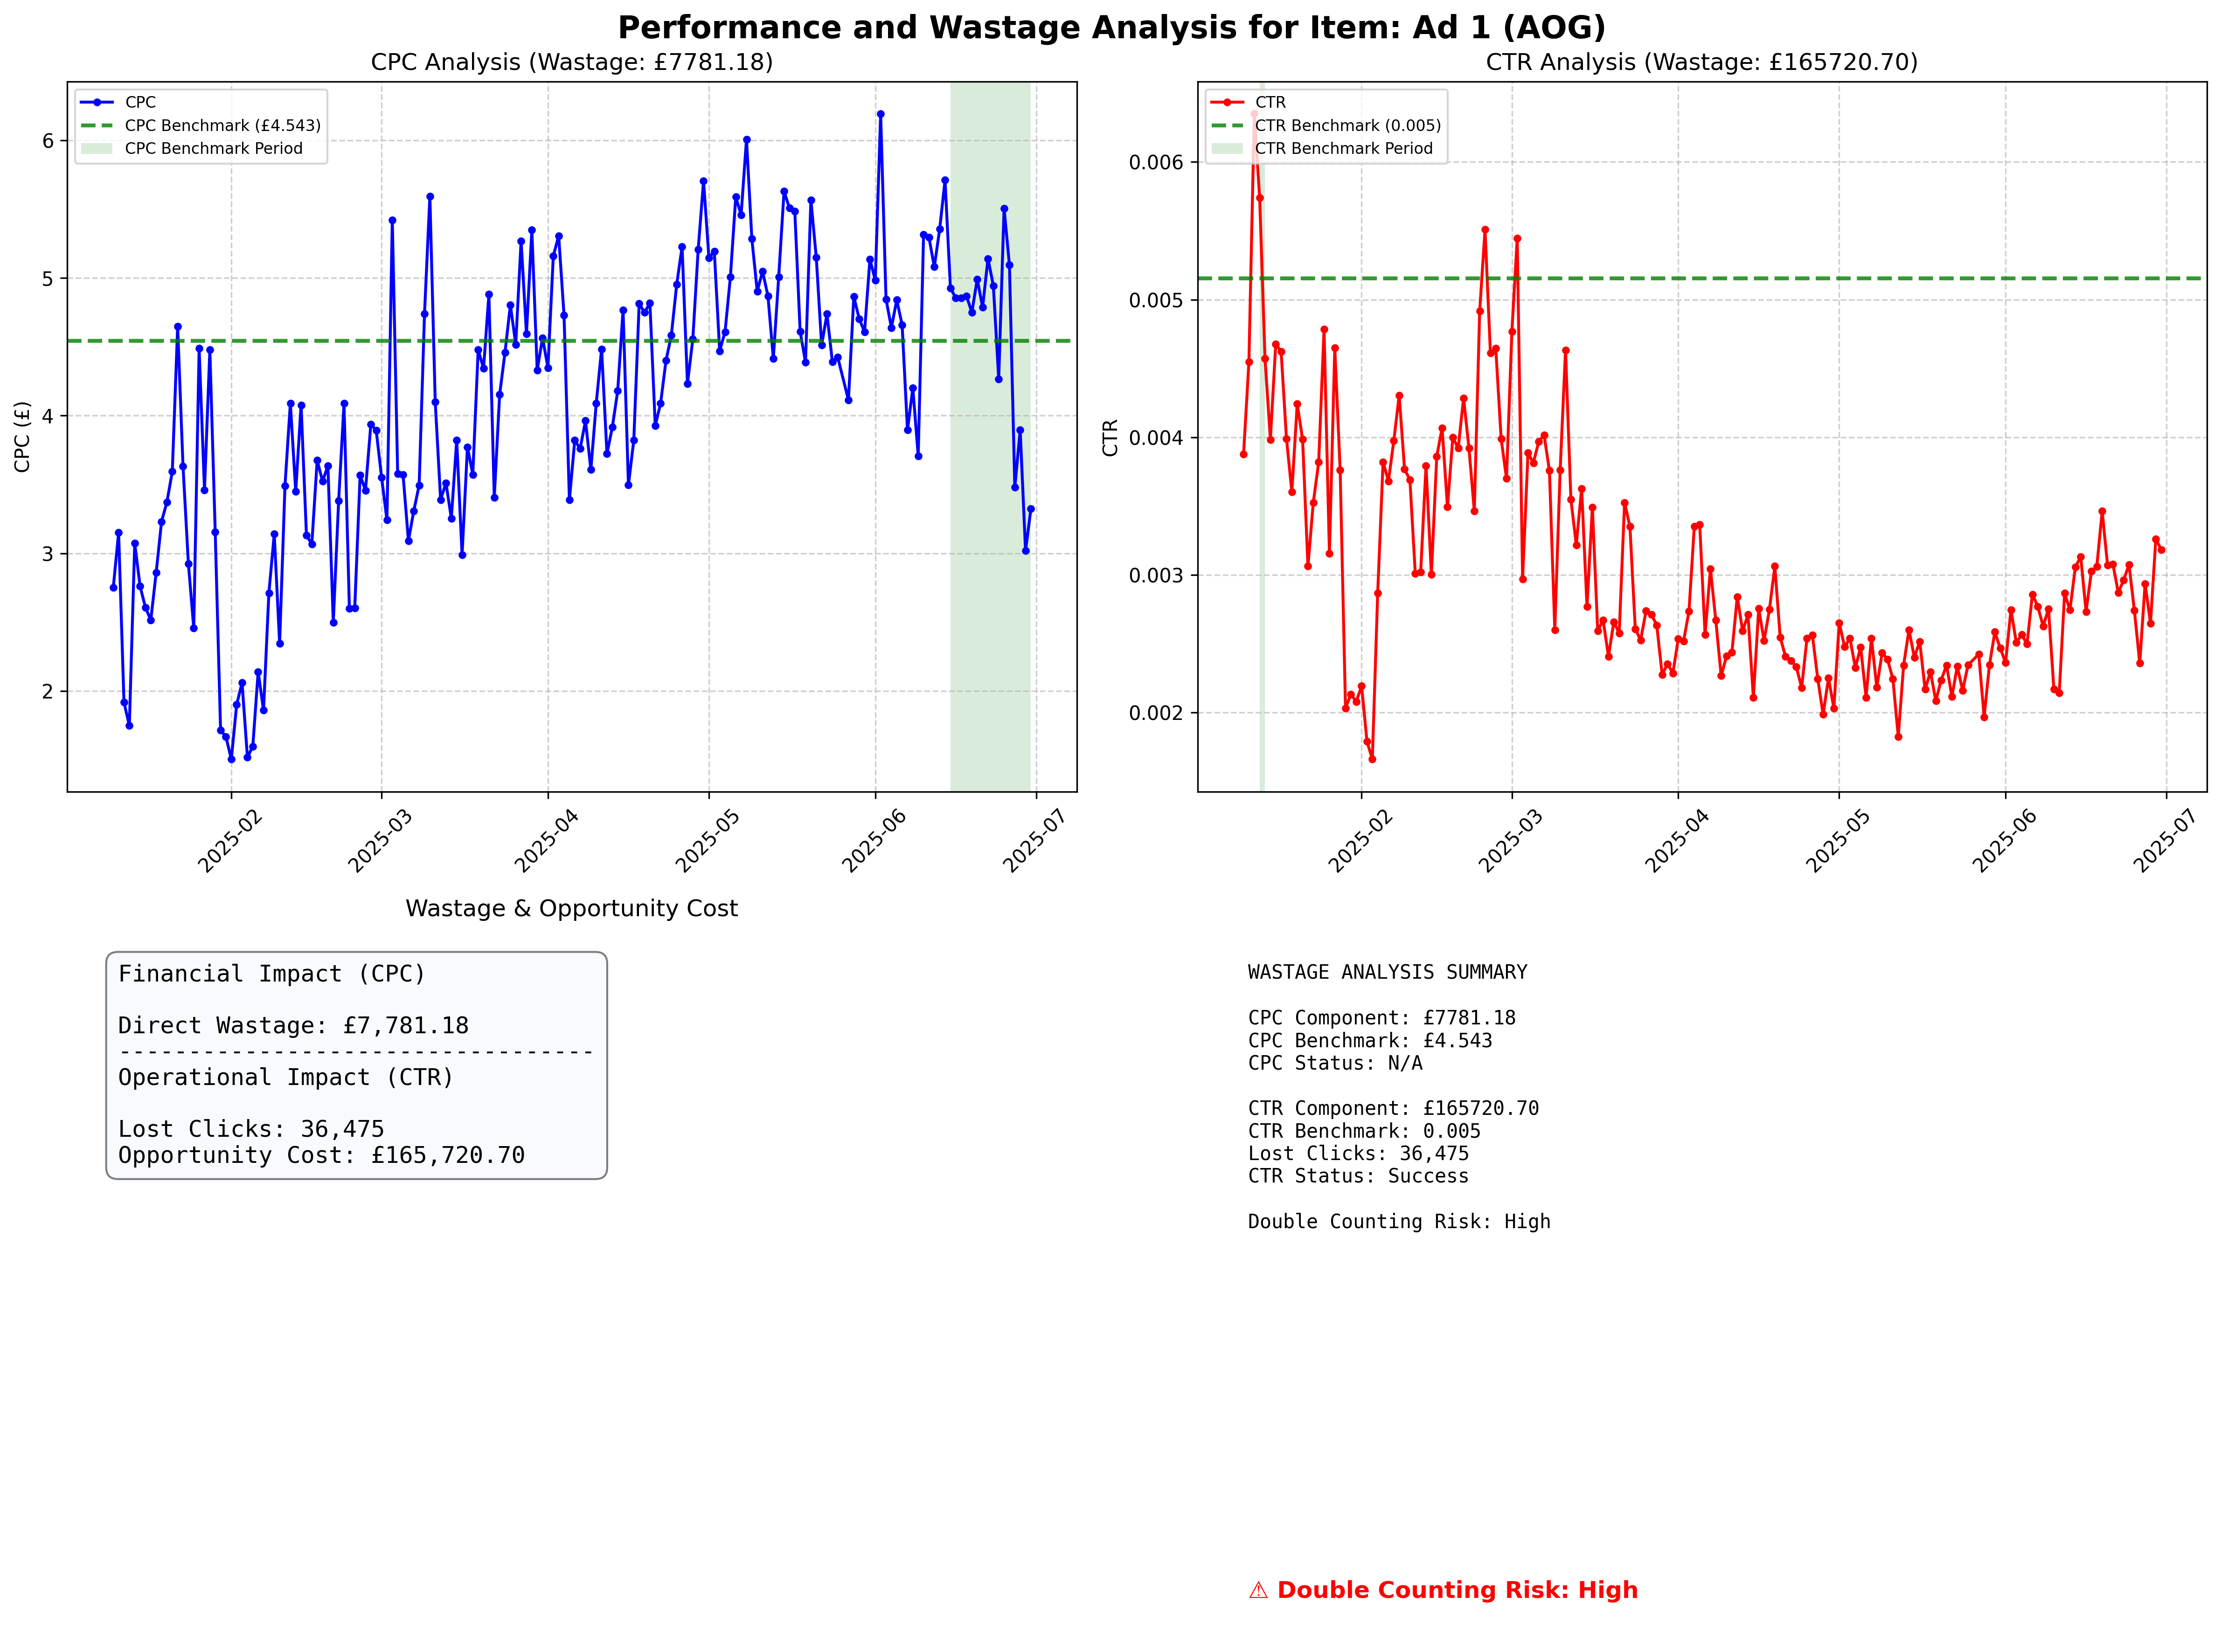
Impact Metrics

  • engagement_gap_clicks (primary)

  • actual_overspend_gbp (secondary, clearly labelled as reference value)

  • Lost clicks due to CTR underperformance (as engagement gap)

  • Absolute and relative impact measurements (reported separately)

Benchmark Information

  • CPC and CTR benchmark values with calculation periods

  • Provides context for impact calculations

  • Shows the performance standards used for comparison

Calculation Status

  • Indicates whether impact calculations were successful

  • “Success” confirms reliable benchmark establishment

  • “Insufficient Data” or “No Declining Periods” indicate limitations

  • Helps assess reliability of results

Analysis Coverage and Exclusions

  • Analysis Coverage %: Proportion of creatives successfully analysed

  • Exclusions Summary: Reasons and counts for excluded creatives

Correlation Risk Indicator

  • Colour-coded severity levels when CPC and CTR move in opposite directions:

    • Low Risk (Green): Weak or positive correlation

    • Medium Risk (Orange): Moderate negative correlation

    • High Risk (Red): Strong negative correlation

    • Unknown Risk (Grey): Insufficient data for correlation analysis

  • Metrics are not combined; interpret engagement_gap_clicks and actual_overspend_gbp separately regardless of risk level

Interpretation Guidelines

Understanding Impact Magnitude

Significant Impact Indicators

  • Large red shaded areas in time series plots

  • Substantial gaps between actual performance and benchmark lines

  • High engagement_gap_clicks and/or notable actual_overspend_gbp magnitudes

  • Extended periods of declining performance

Minimal Impact Indicators

  • Small or absent red shaded areas

  • Performance lines close to benchmark levels

  • Low engagement_gap_clicks and minimal actual_overspend_gbp in summary panel

  • Brief or infrequent declining periods

Correlation Risk Considerations

High Risk Scenarios

  • Strong negative correlation between CPC and CTR (r < -0.7)

  • When CTR declines, CPC often increases proportionally

  • Do not compute any combined total; interpret each metric separately

Low Risk Scenarios

  • Weak or positive correlation between CPC and CTR (r > -0.3)

  • Independent variation in both metrics

  • Use engagement_gap_clicks and actual_overspend_gbp independently; do not add

Reading Signature Distance Patterns

Normal Variation

  • Signature distances fluctuating below the threshold

  • Indicates natural performance variation without significant pattern changes

  • Suggests stable underlying performance dynamics

Pattern Changes

  • Signature distances exceeding the threshold

  • Indicates fundamental shifts in performance patterns

  • May correspond to external factors or creative fatigue

  • Requires investigation and potential intervention

Trend Transitions

  • Clusters of high signature distances

  • Suggests periods of instability or transition

  • May indicate gradual performance degradation

  • Useful for predicting future performance issues

Actionable Insights

Performance Optimisation

  • Focus intervention efforts on periods with large underperformance areas

  • Address the metric contributing most to operational or financial impact

  • Consider creative refresh at detected change points

  • Use signature distance trends for proactive management

Budget Planning

  • Use actual_overspend_gbp for financial inefficiency assessment

  • Use engagement_gap_clicks for operational impact assessment

  • Do not compute or use any combined total

  • Plan intervention timing based on trend segment analysis

  • Allocate resources based on the magnitude and persistence of each metric separately

Campaign Management

  • Monitor signature distances for early warning of performance changes

  • Set alerts when distances approach detection thresholds

  • Use benchmark periods as performance targets for optimisation

  • Implement automated responses to significant pattern changes

Strategic Decision Making

  • Evaluate creative lifecycle based on engagement_gap_clicks and actual_overspend_gbp patterns

  • Compare performance across different creative assets

  • Identify optimal refresh timing to minimise impact

  • Assess ROI of performance optimisation interventions

Technical Considerations

Data Quality Requirements

  • Sufficient data points for reliable signature calculation

  • Consistent measurement methodology across time periods

  • Adequate baseline period for benchmark establishment

  • Regular data collection without significant gaps

Statistical Limitations

  • Signature analysis requires minimum window sizes

  • Benchmark calculations need stable performance periods

  • Correlation analysis requires sufficient data points

  • Risk assessments depend on data quality and completeness

Interpretation Caveats

  • External factors may influence performance patterns

  • Seasonal effects should be considered in analysis

  • Market conditions may affect benchmark relevance

  • Multiple testing considerations for change point detection

This visualisation guide provides the foundation for understanding and interpreting CreativeDynamics analysis results, enabling data-driven decision-making in performance marketing contexts.